|
|
 Pattern Pattern |
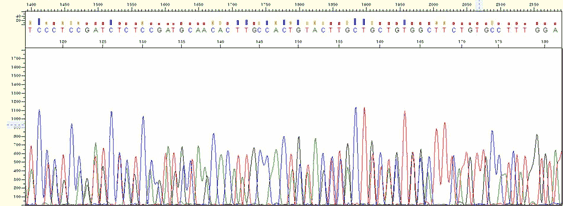
* Peaks are irregular and may appear as if it is just mixed peaks. However, such peaks are actually not normal peaks but just noise signal.
* The signal strength is less than 500.
|
|
| Cause |
* The concentration of DNA is too low.
* The concentration of primer is too low or Tm is inappropriate for the sequencing reaction.
* The primer binding site is not on the sequence of sample DNA.
|
|
| Action |
* To get fine sequencing result, the sample concentration is required as below ;
 Plasmid DNA (high copy number) ; 100-150 ng/ul Plasmid DNA (high copy number) ; 100-150 ng/ul
PCR product ; 25-50 ng/ul
When you check the sample concentration by gel electrophoresis, band should be present on a gel if you load
a sample on 1% agarose gel using 1ul of the sample.
|
* Provide the primer at 5 pmole/ul or 10pmole/ul.
* The annealing temperature for sequencing reaction is 50 (fixed) so Tm is recommended around (fixed) so Tm is recommended around
55-60.
* Check whether the primer binding site exists on the sequence of sample DNA
* In case of plasmid, compare the sequence between the sequencing primer and the vector to confirm whether the primer binding site exists.
* Especially for primer M13R and M13R-pUC(-40), there is difference between vector providers for primer names, so it is required to check the sequence all the time whether the primer´s sequence is on the sequence of the sample.
Primer M13R ; GCGGATAACAATTTCACACAGG
Primer M13R-pUC(-40) ; CAGGAAACAGCTATGAC
|
* The primer binding site might be damaged. We would like to recommend that you try to use alternative primer.
|
|
|
 |
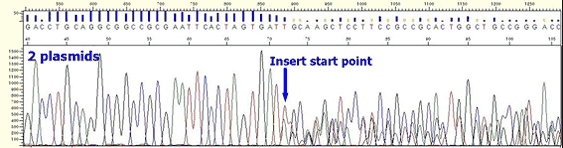
| Figure1. No Signal |
|
 |
|
 |
|
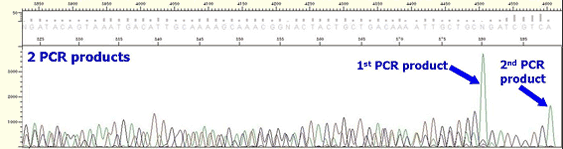
| Pattern |
* In case of plasmid, multiple peaks appear from the beginning of insertion position although clear peaks are shown up to vector position.
* In case of PCR product, the following aspects appear depending on what kind of non-specific PCR product is.
If the mixed non-specific PCR product has similar size with the expected PCR product ;
Mixed sequence is present from the beginning to the end. In case two PCR products have similar sizes, it can be shown as if it is single band on a agarose gel.
If the mixed non-specific PCR product is with Insertion or deletion;
Sequence becomes mixed at position of Insertion or deletion although clean peaks are present in the beginning. For most cases, such non-specific PCR product is longer or shorter just several bases than the expected PCR product, this also can be shown as if it is single band on a agarose gel.
|
|
| Cause |
* In the process of plasmid DNA preparation, two colonies are picked simultaneously.
* Not only PCR product you target but also there is non-specific PCR product.
|
|
| Action |
|
* Preparing a new DNA sample is recommended.
|
|
|
|
|
|
 |
|
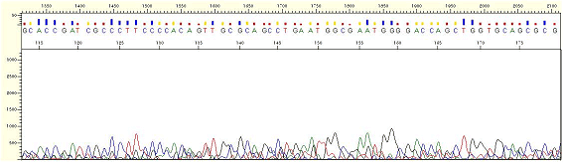
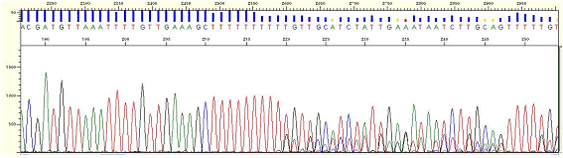
| Pattern |
|
* Multiple peaks appear from a certain point.
|
|
| Cause |
|
* Compression occurs due to DNA fragments of different size with the same electrophoretic mobility. This phenomenon is thought to be caused by regions of secondary structure within the template DNA and as different peaks are detected simultaneously it appears as multi-peaks and although it rarely happens, but it can be found in the regions with a high G/C or high A/T content.
|
|
| Action |
|
* Confirm whether the result is improved by using the opposite direction primer.
|
|
|
 |
| Figure3. Compression |
|
|
|
 |
|
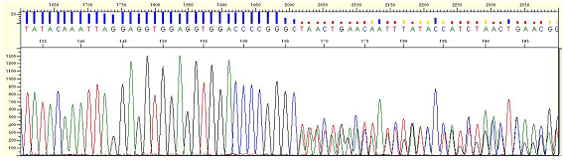
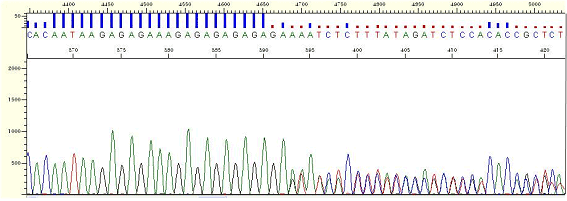
| Pattern |
|
* Multiple peaks appear at a different position with good signal strength.
|
|
| Cause |
* If accidentally more than 2 regions have homology for the primer binding sequence the primer has multiple bindings although the template is one.
* When more than 2 different templates are mixed this phenomenon appears. When 2 PCR products with the similar size are mixed, it looks a single band on the agarose gel.
|
|
| Action |
* Design a long primer or design a new primer being able to avoid multiple binding.
* The use of an opposite direction primer can be helpful.
* If more than 2 similar sized products are mixed, redo PCR in a more optimized PCR
|
|
|
 |
| Figure4. Multiple Binding |
|
|
|
 |
|
| Pattern |
|
* The phenomenon that mixed peaks appear in the back position of long homo-polymer region.
|
|
| Cause |
|
* Pairing occurs incorrectly in homopolymer region during polymerization
|
|
| Action |
* Try sequencing by both directions. For example, if slippage pattern appears when the reverse primer is used try sequencing toward the forward direction.
* Perform sequencing by designing a new primer avoiding homopolymer region.
|
|
|
 |
| Figure5. Homopolymer region-poly A |
|
|
|
 |
|
| Pattern |
|
* Partly 1 base peak appears as a double peak in the normal sequencing data.
|
|
| Cause |
|
* It can be caused by SNP or rarely point mutation.
|
|
| Action |
|
* Compare the reaction results after several runnings if base calling is suspected.
|
|
|
 |
| Figure6. Mixed Base |
|
|
|
 |
|
| Pattern |
* Small peaks appears on the whole as like background.
* Lower peaks from the base which is the same as the major peaks are shown right before major peaks.
|
|
| Cause |
* Primer purification was not done properly during synthesis processes.
* The primer was degraded.
* The primer binding site in the sample is not appropriate.
|
|
| Action |
* Mostly, this phenomenon is caused by primer purification or degradation. The clear results can be obtained by sequencing with the primer resynthesized.
* Degradation can be confirmed by Psomagen MALDI (Matrix-assisted laser desorption/ionization) and Psomagen offers the service.(When employing oligonucleotides prepared 6 months or around 1 year ago check whether the degradation occurs before use or use oligonucleotides newly synthesized.
|
|
|
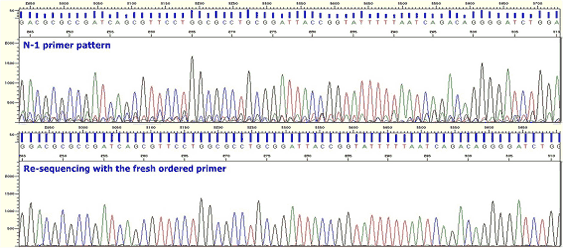 |
| Figure7. N-1 Primer |
|
|
|
 |
|
| Pattern |
* Minor peaks, the same as N-1 primer pattern appears from a certain point.
* The difference from N-1 primer is whereas N-1 peak appears from right after primer binding in case of N-1 primer it appears from the middle point in case of Frameshift Mutation.
|
|
| Cause |
|
* Several products are made in a sample because one or more than one base is inserted or deleted in a template.
|
|
| Action |
|
* Sample DNA should be newly prepared
|
|
|
 |
| Figure8. Frameshift mutation (PCR samples) |
|
|
|
 |
|
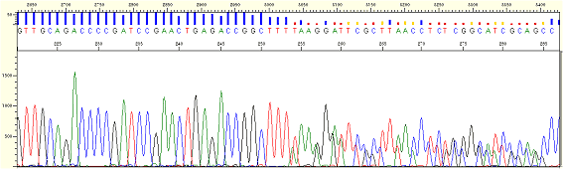
| Pattern |
|
* It is the phenomenon that the peaks in back portion are overlapped due to the repetitive sequence (the repetition of 2 or more bases is shown).
|
|
| Cause |
|
* It is thought that polymerase processing is interfered by repetitive sequence or the secondary structure is formed.
|
|
| Action |
|
* Use the Difficult sequencing service of Psomagen. Difficult sequencing service of Psomagen is specialized for the case of signal decrease or sudden signal loss caused by unusual secondary structure or high GC sequence.
Refer to http://www.macrogen.com/eng/sequencing/dna.jsp
|
|
|
 |
| Figure9. repeat-[GA] |
|
|
|
 |
|
| Pattern |
|
* Peaks are suddenly stopped or rapidly lower. Whereafter data are not gained.
|
|
| Cause |
|
* There is secondary structure existed in the sample.
|
|
| Action |
* Perform sequencing toward the opposite direction of the corresponding result.
* Use the Difficult sequencing service of Psomagen. Difficult sequencing service of Psomagen is specialized for signal decrease or sudden signal loss caused by unusual secondary structure or high GC sequence.
Refer to http://www.macrogen.com/eng/sequencing/dna.jsp
|
|
|
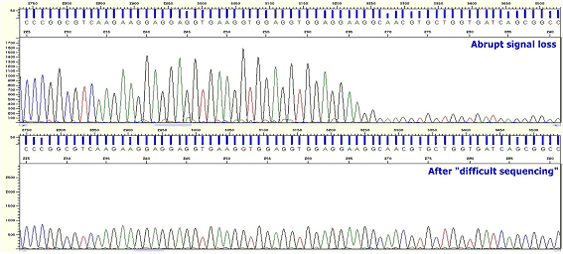 |
Figure10. Abrupt Signal Loss
|
|
|
|
 |
|
| Pattern |
|
* One or more peaks appear as wider and over-intensified peaks, commonly between 50 and 140.
|
|
| Cause |
* This phenomenon can be shown when the sample volume is not used properly, based on the sample concentration.
* Very small quantity of BigDye left in the clean up process appears as large dye blob peaks. left in the clean up process appears as large dye blob peaks.
|
|
| Action |
|
* Reduce the error as measuring the sample concentration by a gel electrophoresis and spectrophotometer.
|
|
|
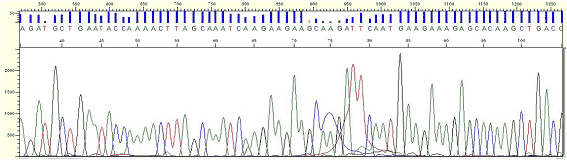 |
Figure11. Dye Blob
|
|
|
|
| |


 Psomagen policies for retesting